

Market Outlook - Global equities: The great divide
KEY POINTS
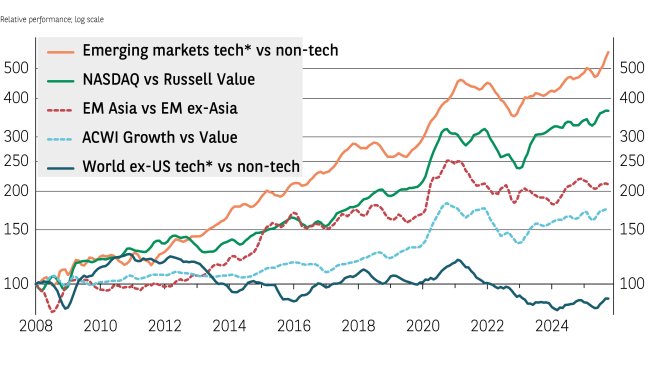
US equity market returns are likely to continue diverging along the lines of technology and the rest of the market: the Nasdaq 100 index delivered a 50% return from the post-Liberation Day lows to the end of October while the Russell 1000 Value index rose by less than half that. That outperformance continues a long-running trend (see Exhibit 1).
We believe technology company earnings can continue to appreciate at a robust, albeit slower, pace next year as the artificial intelligence (AI) revolution continues to drive heavy capital expenditure — and eventually profits across all sectors.
AI’s greatest impact will ultimately be in the other parts of the economy as companies implement the technology to drive earnings growth. This will partly come from reducing labour costs; and the US labour market’s flexibility suggests AI will be integrated more fully, and more quickly, in the US than elsewhere.
The Nasdaq’s strong 2025 gains have been roughly in line with earnings growth, meaning that valuations, while high, have not meaningfully increased. By contrast, the Russell index’s gains have outpaced earnings, leading to an atypically high price-earnings (P/E) multiple (see Exhibit 2).
If AI is indeed a bubble set to burst, valuations will quickly fall, but interest rates should not prompt a downturn like they did in 2022 as the Federal Reserve is looking to lower the policy rate next year instead of increasing it.
A benign way that the index multiple could revert towards its mean would be for the index price to appreciate less than the gain in earnings. With forecasts of 15% earnings growth for the Nasdaq in 2026, there is still room for potentially good investment returns even as multiples compress.
This dynamic of prices rising at a slower rate than earnings would also reduce the high multiple for the US small cap index. The Russell 2000 forward P/E is quite elevated, but earnings growth is also very strong, forecast to advance by over 20% next year.
Given the US’s positive macroeconomic backdrop — deregulation, more mergers and acquisitions activity, rising business investment, wage growth, falling policy rates, and low energy prices — we are optimistic these earnings expectations can mostly be realised.
US small-cap stocks are nonetheless unlikely to sustainably best the S&P 500 due to the weight, and long-term superior performance, of the technology sector. But small caps offer another way to access US economic growth without increasing exposure to the tech sector.
Europe’s autonomy
European corporates have struggled in the face of US tariffs, a stronger euro, and increased Chinese imports. The disruption to the international political and economic order unleashed by the new US administration has spurred Europe to try and reduce its dependence on the US, for example by increasing its capabilities in defence — an initiative called Strategic Autonomy.
Many investors are looking for fiscal stimulus directed to infrastructure and defence to boost corporate profits. Indeed, earnings for the MSCI Europe Aerospace & Defense index are forecast to advance by over 25% next year. We believe this initiative will help the region to offset the US tariff drag and assist the reorientation towards a less export-dependent economic model.
To balance growth exposure in portfolios, investors have the choice of the US Russell 1000 Value index, MSCI Europe or MSCI Japan, which all have a similar sector composition. Expectations for earnings growth are also similar for 2026 at 8%, 12% and 13%, respectively.
While there is little difference in the growth rates, Exhibit 2 shows there is a significant gap in valuations. Both US value stocks and Japan have P/E ratios well above average, while Europe seems to offer the best value.
Exhibit 2: Forward price-earnings ratio z-scores
| Market | United States | Japan* | Russell Value | Developed Markets | US Small Cap | NASDAQ | EM Broad Tech** | EM ex-Broad Tech | Europe |
|---|---|---|---|---|---|---|---|---|---|
| P/E | 1.6 | 1.5 | 1.5 | 1.4 | 1.2 | 0.5 | 0.5 | 0.3 | 0.2 |
Data as at 11 November 2025. *Calculated from 2010; for all other indices calculated from inception.
** Technology, Broadline Retail, Interactive Media & Services. Sources: IBES, Bloomberg, BNP Paribas Asset Management.
Emerging markets potential
Low US Treasury yields, and a weaker US dollar, are typically positive factors for emerging market equities. Export-oriented countries, however, may struggle compared to those that can rely on a large, growing domestic market to generate profits.
As in the US, however, it is primarily the technology sector which is generating superior returns within emerging markets. As Exhibit 1 illustrates, the sector has outperformed the rest of the market by an even greater degree than the Nasdaq has outperformed the Russell Value index.
Of the three countries with the largest technology sectors — South Korea, Taiwan, and China — the latter offers greater diversity than the semiconductor-focused markets of Taiwan and South Korea. We believe China’s technology sector has the additional advantage of being somewhat protected from the current trade tensions between the US and China. Technology companies derive a greater share of their revenues from services rather than goods and so are less affected by tariffs. Given the size of China’s domestic market, its high level of engineering talent (for example, the developers of DeepSeek), and desire to develop its own technological ecosystem, we believe technology companies can generate meaningful future profit growth, despite the challenges facing the domestic economy.
| “The tech sector has been generating superior returns in emerging markets.” |


Disclaimer
This document is for informational purposes only and does not constitute investment research or financial analysis relating to transactions in financial instruments as per MIF Directive (2014/65/EU), nor does it constitute on the part of AXA Investment Managers or its affiliated companies an offer to buy or sell any investments, products or services, and should not be considered as solicitation or investment, legal or tax advice, a recommendation for an investment strategy or a personalized recommendation to buy or sell securities.
Due to its simplification, this document is partial and opinions, estimates and forecasts herein are subjective and subject to change without notice. There is no guarantee forecasts made will come to pass. Data, figures, declarations, analysis, predictions and other information in this document is provided based on our state of knowledge at the time of creation of this document. Whilst every care is taken, no representation or warranty (including liability towards third parties), express or implied, is made as to the accuracy, reliability or completeness of the information contained herein. Reliance upon information in this material is at the sole discretion of the recipient. This material does not contain sufficient information to support an investment decision.
Disclaimer
BNP Paribas Group's acquisition of AXA Investment Managers was completed on 1 July 2025, and AXA Investment Managers is now part of BNP Paribas Group.
This website is published by AXA Investment Managers Asia Limited (“AXA IM HK”), an entity licensed by the Securities and Futures Commission of Hong Kong (“SFC”), for general circulation and informational purposes only. It does not constitute investment research or financial analysis relating to transactions in financial instruments, nor does it constitute on the part of BNP Paribas Asset Management or its affiliated companies an offer to buy, sell or enter into any transactions in respect of any investments, products or services, and should not be considered as solicitation or investment, legal, tax or any other advice, a recommendation for an investment strategy or a personalised recommendation to buy or sell securities under any applicable law or regulation. It has been prepared without taking into account the specific personal circumstances, investment objectives, financial situation, investment knowledge or particular needs of any particular person and may be subject to change at any time without notice. Offering may be made only on the basis of the information disclosed in the relevant offering documents. Please consult independent financial or other professional advisers if you are unsure about any information contained herein.
Due to its simplification, this publication is partial and opinions, estimates and forecasts herein are subjective and subject to change without notice. There is no guarantee such opinions, estimates and forecasts made will come to pass. Actual results of operations and achievements may differ materially. Data, figures, declarations, analysis, predictions and other information in this publication is provided based on our state of knowledge at the time of creation of this publication. Information herein may be obtained from sources believed to be reliable. AXA IM HK has reasonable belief that such information is accurate, complete and up-to-date. To the maximum extent permitted by law, BNP Paribas Asset Management, its affiliates, directors, officers or employees take no responsibility for the data provided by third party, including the accuracy of such data. This material does not contain sufficient information to support an investment decision. References to companies (if any) are for illustrative purposes only and should not be viewed as investment recommendations or solicitations.
All investment involves risk, including the loss of capital. The value of investments and the income from them can fluctuate and that past performance is no guarantee of future returns, investors may not get back the amount originally invested. Investors should not make any investment decision based on this material alone.
Some of the services listed on this Website may not be available for offer to retail investors.
This Website has not been reviewed by the SFC. © 2026 BNP Paribas Asset Management. All rights reserved.