
How to consider a B/BB US high yield strategy within a portfolio
- 05 December 2023 (7 min read)
The US high yield market has performed well in 2023, offering investors attractive all-in yields and a healthy fundamental backdrop during a year that has been marred with uncertainty and surprises. Many high yield companies came into 2023 having taken advantage of cheap borrowing costs from previous years. They have, therefore, largely been able to weather the rising rates environment without needing to refinance. In many cases they have also used free cash flow to pay down debt and de-lever. This can be seen by the fact that both high yield leverage and coverage ratios are coming off historically strong levels, albeit starting to deteriorate towards the end of 2023 as the ‘higher for longer’ interest rate environment drives dispersion higher. This is particularly seen amongst more levered, capital-intensive companies that do not have the cashflow to absorb significant interest rate increases.
Although this increasing dispersion is leading to a pick-up in default activity, driven particularly by a larger proportion of distressed exchanges and borrowers who also have a loan component in their capital structure which is more immediately impacted from higher rates, we continue to believe that corporate fundamentals remain robust enough to prevent the default rate of the US high yield bond market from increasing to a level significantly higher than its long-term average (3.3% according to JP Morgan).
In this environment, we think that a higher quality high yield strategy offers compelling opportunities to investors who are seeking a yield pick-up from investment grade but remain concerned about the macro environment and want to avoid the part of the high yield market which has historically carried the most default risk. Based on our outlook for the economy and current valuations, we believe that this portion of the US high yield market can deliver attractive total returns over the next 12 months and beyond.
Understanding the high yield credit spectrum
For some investors, accessing the full spectrum of the high yield market is not possible due to capital risk or regulatory requirements. For others, it may be possible, but concerns around default rates may dictate a preference for a higher quality approach. An option for such investors may be to take a more selective approach to high yield and invest via a B/BB strategy rather than avoid high yield altogether.
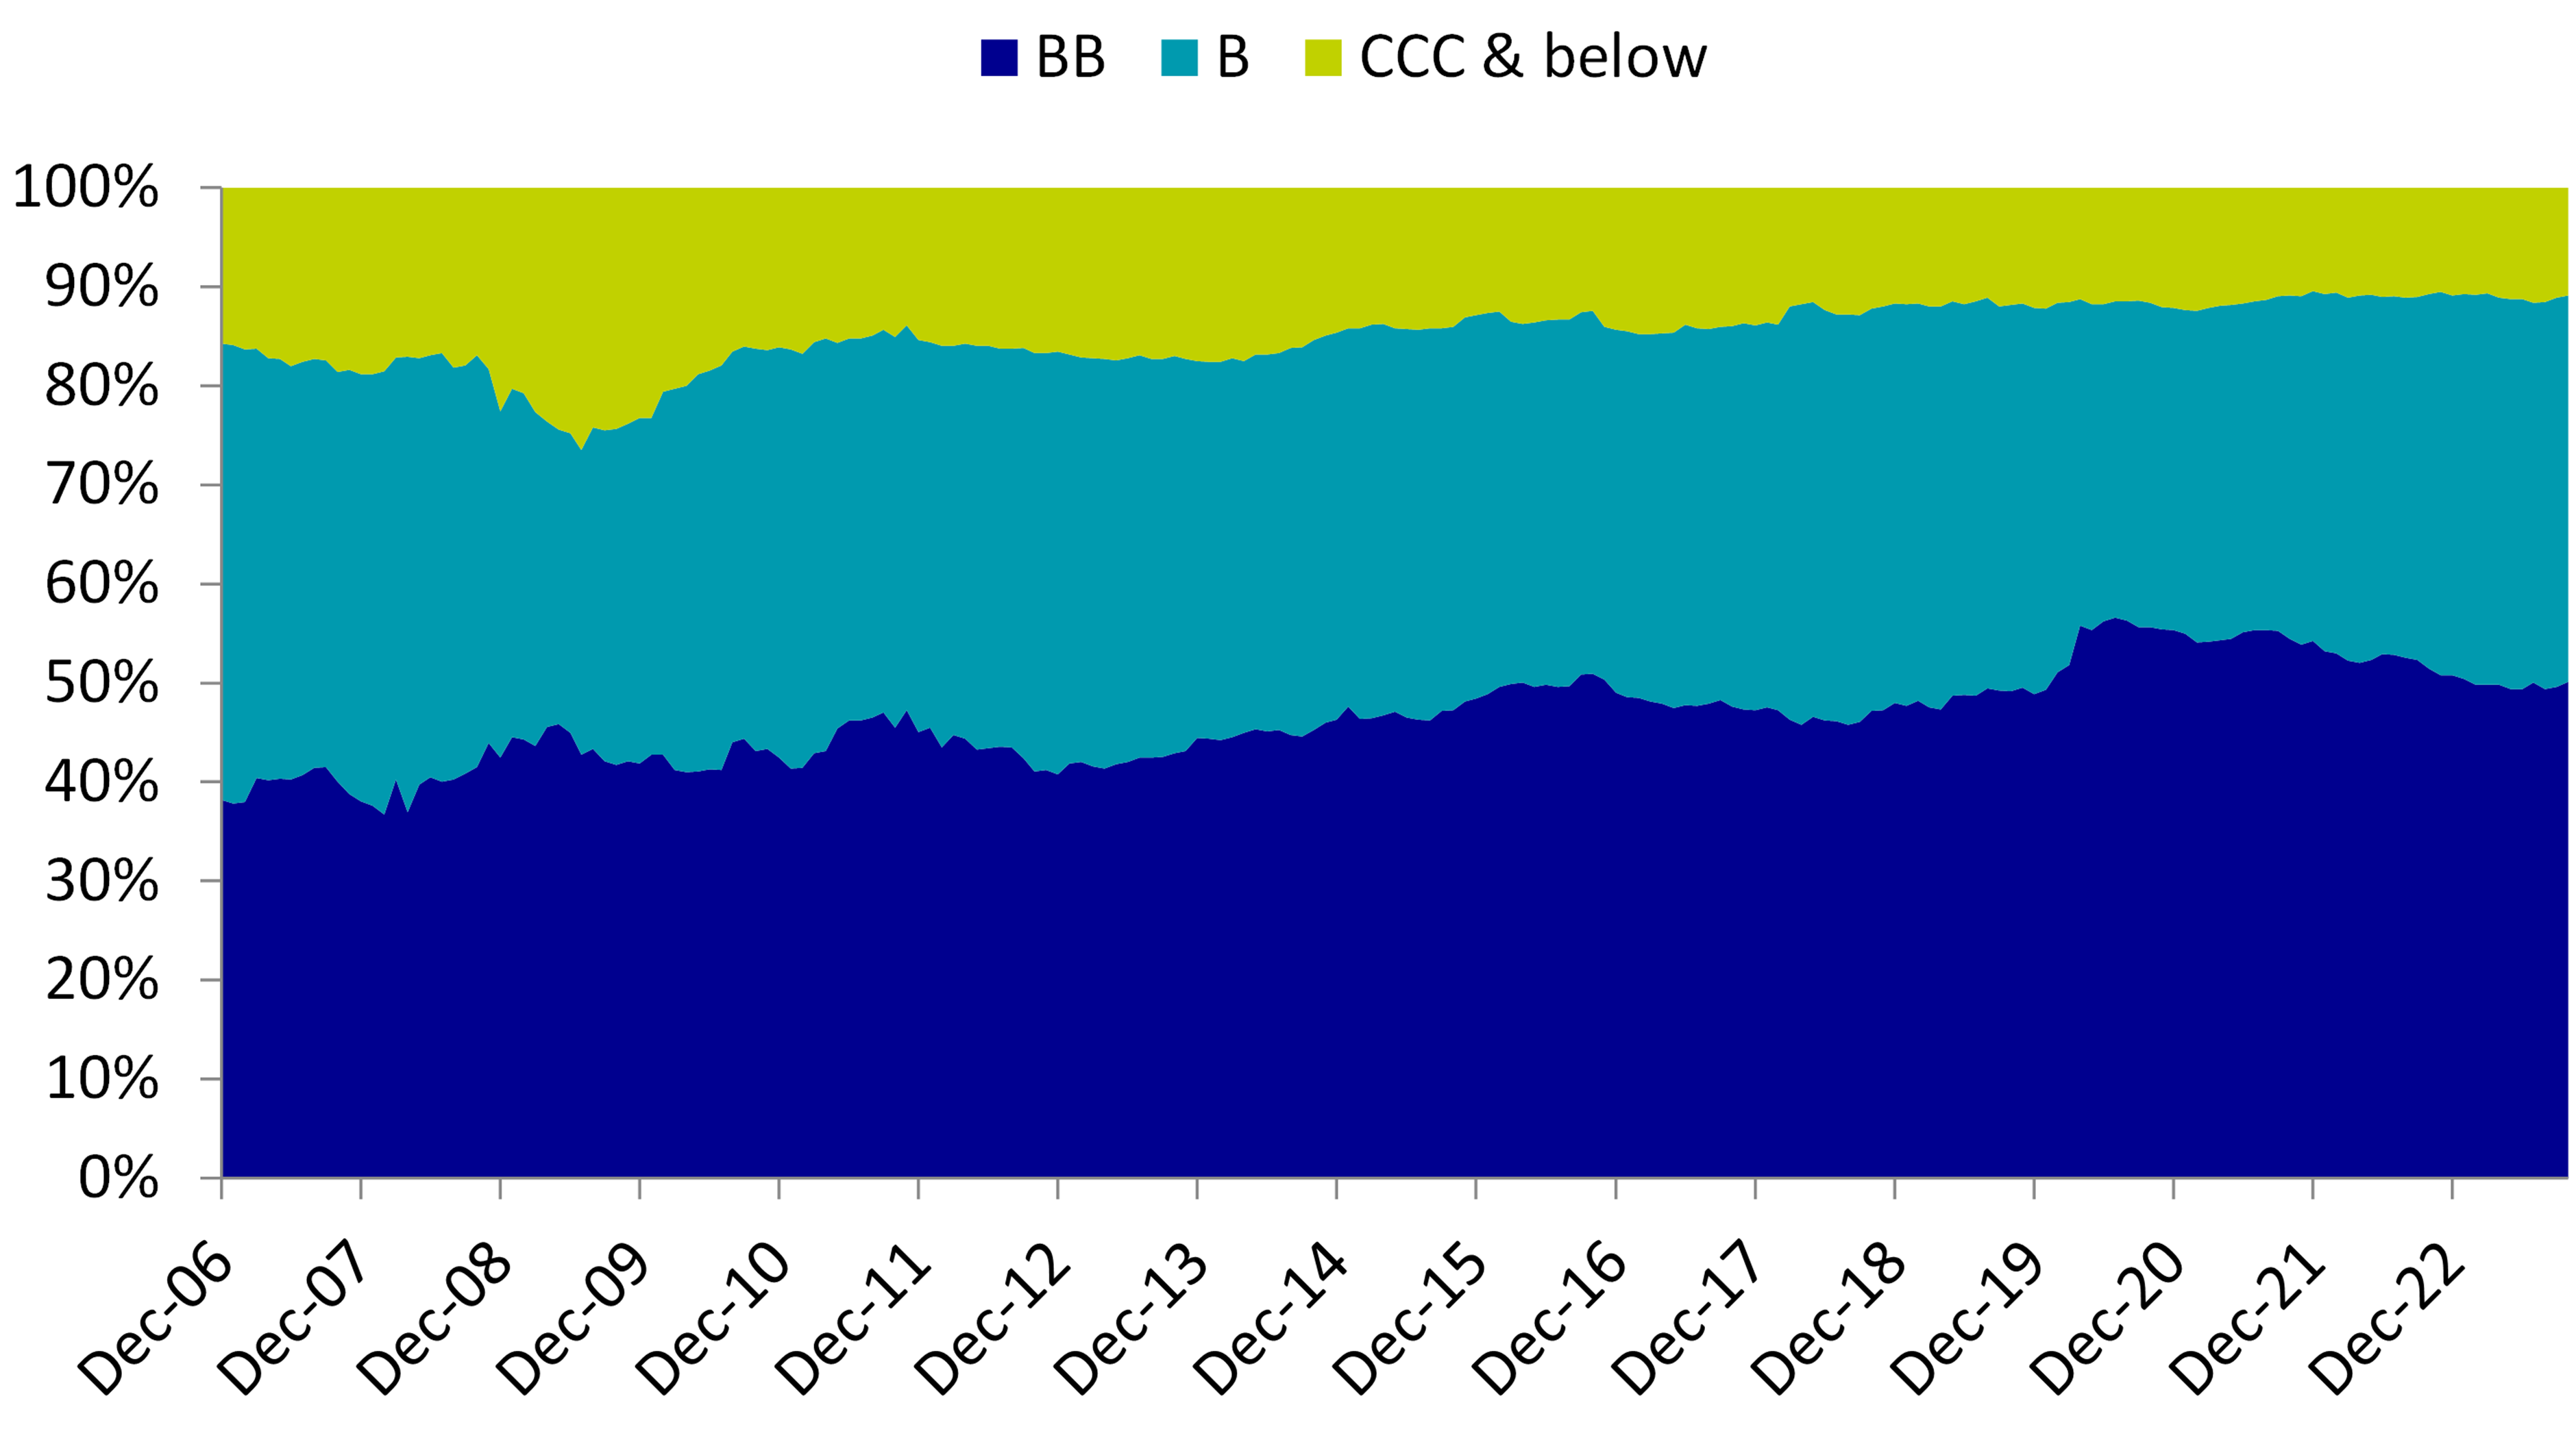
This selective approach to high yield investing does not have to feel like a compromise. Firstly, over the past few years, there have been a wave of upgrades within the US high yield market1 and downgrades from investment grade to BB.2 This has resulted in the US high yield market, which numbers 880 issuers3 in total, moving up in quality: today just 11% of the broad market is rated CCC and below, compared to 49% rated BB and 40% rated B. As the chart below demonstrates, although the lowest rated part of the market has historically always accounted for the smallest component by market value, at more distressed points of the cycle we have seen the amount of CCC and below securities rise as high as 26% in 2009 after the Global Financial Crisis and 15% in 2017 after the wave of energy company downgrades. The historically low percentage of CCC securities in the market today is a sign of strong fundamental strength, but also means that B/BB investors still have access to around 90% of the overall market in market value terms.
Breakdown of the US high yield market by credit rating buckets
Despite representing the smallest rating bucket by market value, the CCC and below component accounts for the largest proportion of default activity within the US high yield market. We believe that the ‘truest’ way of measuring the credit rating spectrum is on an exponential rather than linear scale, with the credit curve acting as an indicator of underlying default risk, measured in spread (basis point) terms. Credit spreads increase exponentially down the curve to compensate for the underlying credit risk, highlighted by the chart below.
This chart, which plots the average spread of different rating buckets across the full US credit spectrum over a 20-year period, shows that the spread differential between BBB and BB rated securities is 154bps, whereas the difference between B and CCC rated securities is higher at 493bps. Therefore, we may consider that, despite BBB and BB securities being differentiated by rating agencies in terms of ‘investment grade’ versus ‘high yield’, they have more in common than BB securities have with CCC securities.
Plotting the US credit spectrum by average spread*
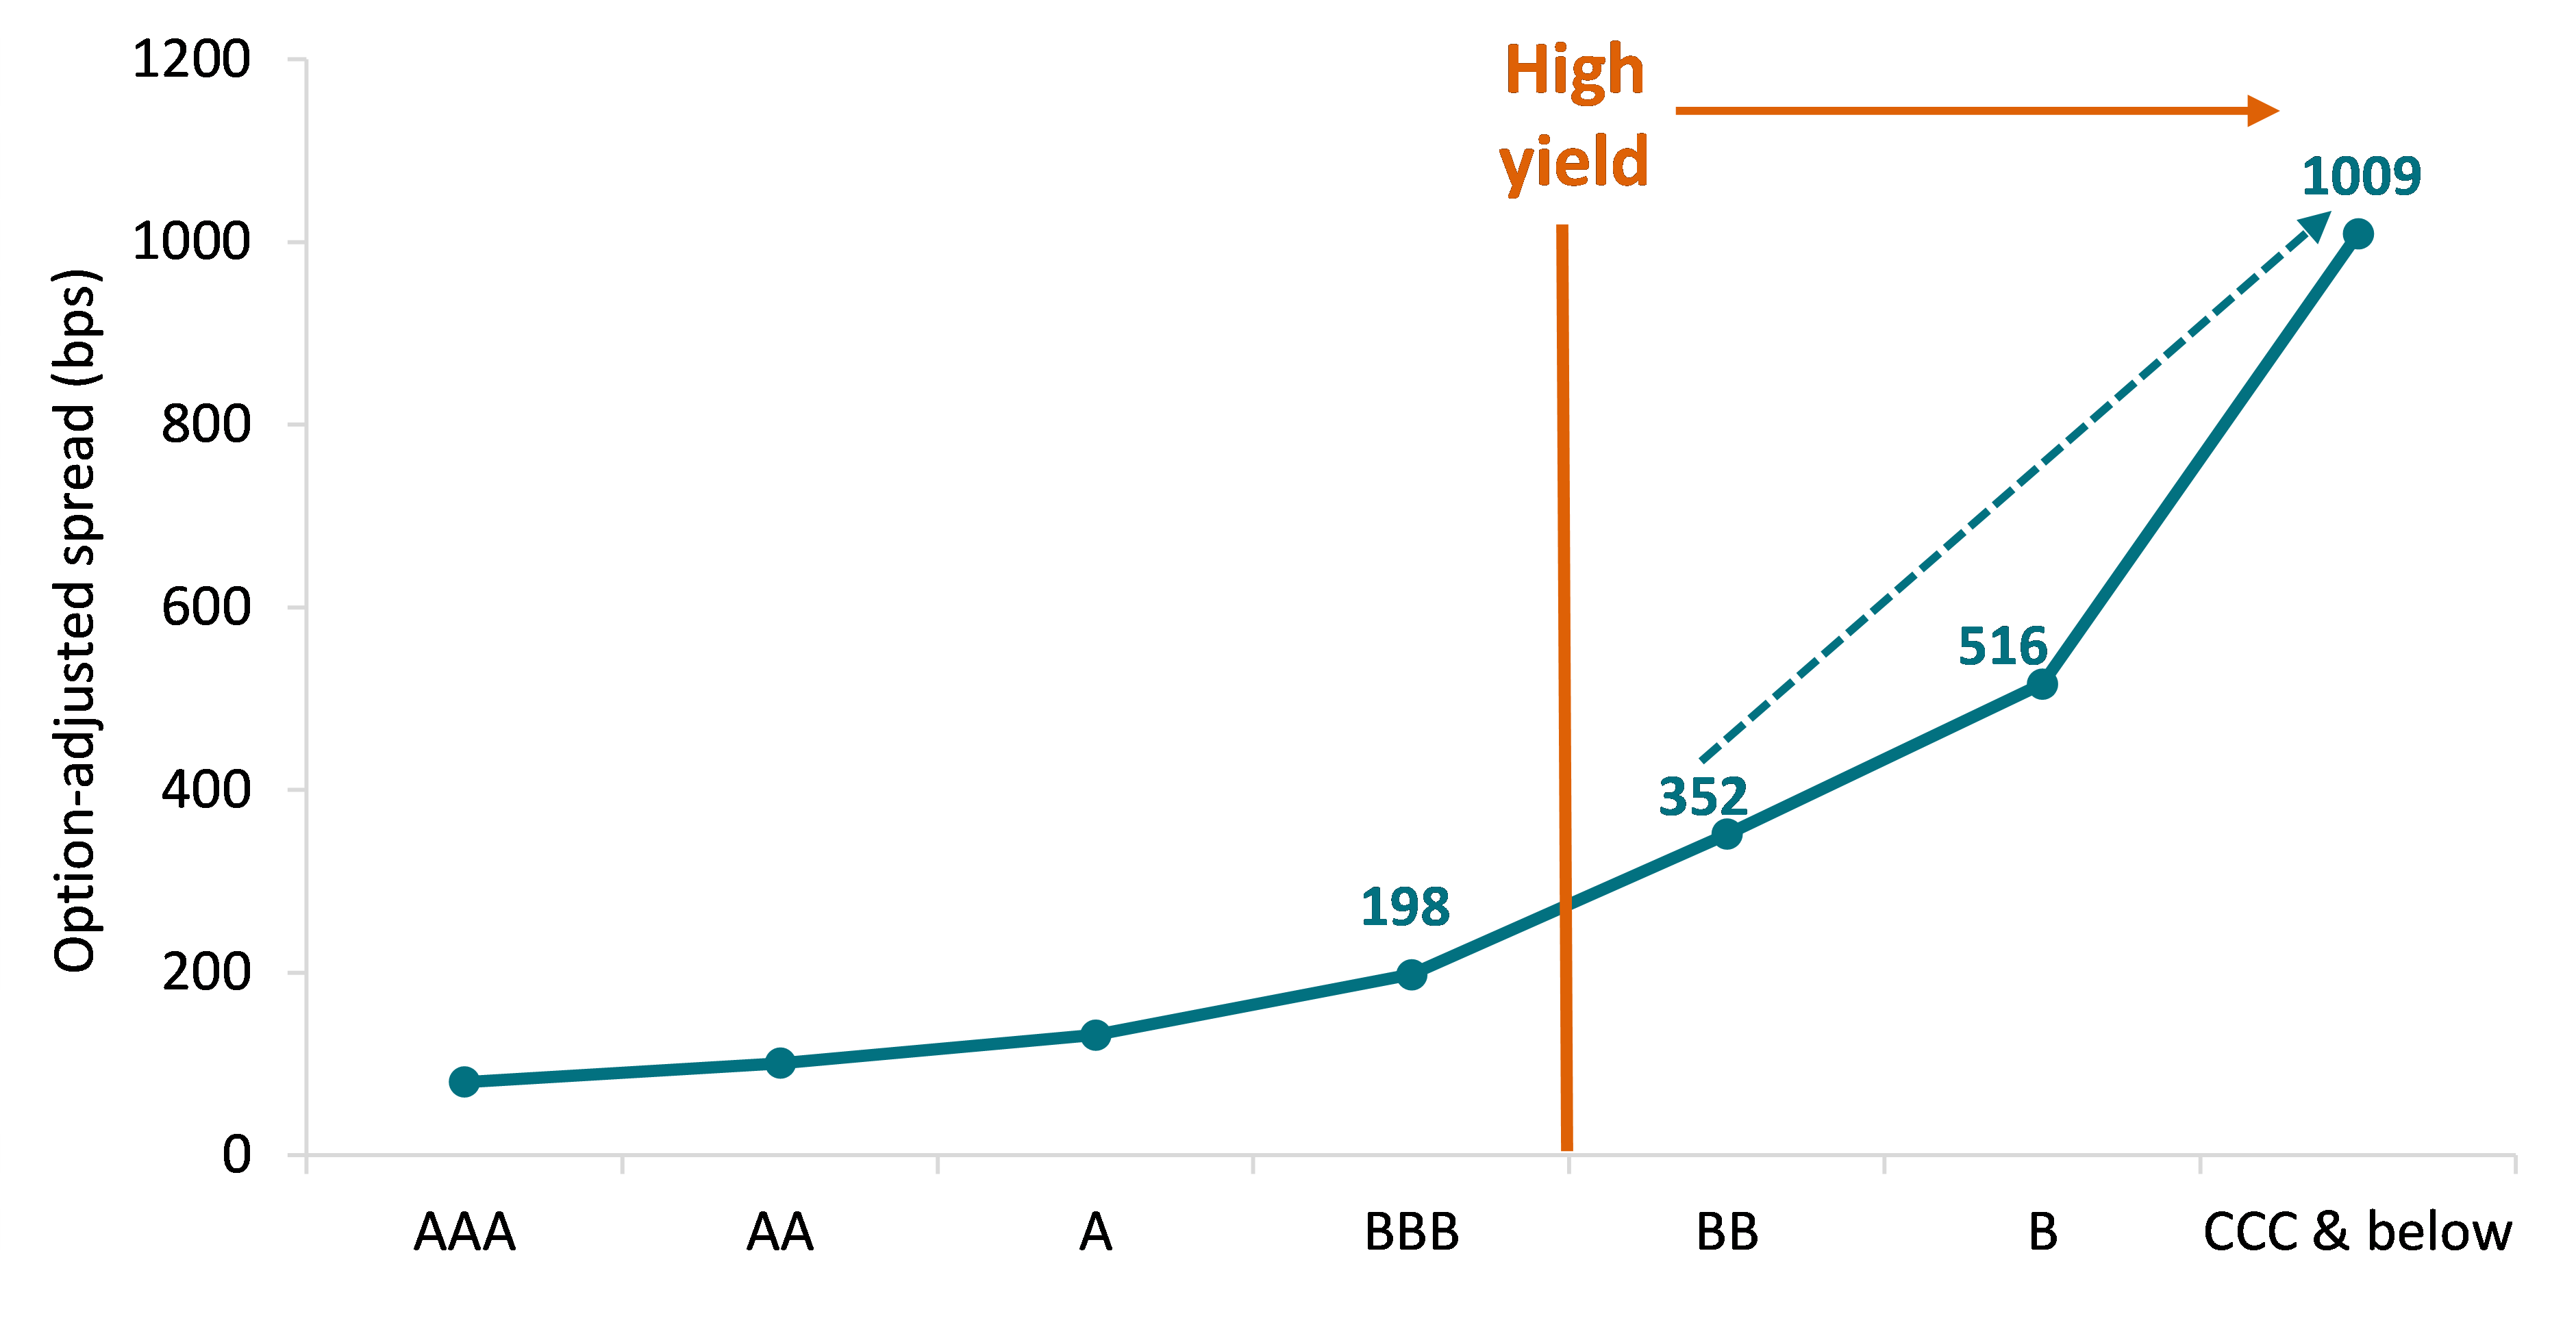
Source: AXA IM, ICE BofA, as of 31 October 2023. * Average spread relates to a 20-year period covering 31 October 2003 to 31 October 2023.
This exponential credit risk is reflected in the fact that the bulk of historical high yield default activity has occurred within the CCC rated bucket. Looking at the 25-year average default rate the largest component of this is CCC/split CCC, tracking at around double the overall high yield default rate of 2.99% for this period:
Source: JP Morgan as of 31 December 2022. *Evolution of default rate taking into account full calendar year data, including distressed exchanges. For illustrative purposes only. Investing involves risk and past performance does not guarantee future results. No assurance can be given that the strategy will be successful or achieve its objectives.
That is not to say that we do not like investing in CCC rated securities. To the contrary, we find plenty of opportunities in improving CCC rated credits that may be penalised by rating agencies for having higher leverage and lower asset values, but which we believe have sound fundamentals and hence less business or operational risk. We feel comfortable holding these credits, however believe that robust, prudent credit analysis and active management are required to ensure that we try to avoid losses and defaults.
- QmV0d2VlbiAyMDIwIGFuZCAyMDIy
- SW4gMjAyMA==
- U291cmNlOiBBWEEgSU0sIEJsb29tYmVyZyBhcyBvZiAzMCBOb3ZlbWJlciAyMDIz
Related articles
View all articles

The Case for US investment grade credit
- by
- 30 June 2023 (3 min read)

Euro credit market review - May 2023
- by
- 10 May 2023 (5 min read)

Disclaimer
This website is published by AXA Investment Managers Asia Limited (“AXA IM HK”), an entity licensed by the Securities and Futures Commission of Hong Kong (“SFC”), for general circulation and informational purposes only. It does not constitute investment research or financial analysis relating to transactions in financial instruments, nor does it constitute on the part of AXA Investment Managers or its affiliated companies an offer to buy, sell or enter into any transactions in respect of any investments, products or services, and should not be considered as solicitation or investment, legal, tax or any other advice, a recommendation for an investment strategy or a personalised recommendation to buy or sell securities under any applicable law or regulation. It has been prepared without taking into account the specific personal circumstances, investment objectives, financial situation, investment knowledge or particular needs of any particular person and may be subject to change at any time without notice. Offering may be made only on the basis of the information disclosed in the relevant offering documents. Please consult independent financial or other professional advisers if you are unsure about any information contained herein.
Due to its simplification, this publication is partial and opinions, estimates and forecasts herein are subjective and subject to change without notice. There is no guarantee such opinions, estimates and forecasts made will come to pass. Actual results of operations and achievements may differ materially. Data, figures, declarations, analysis, predictions and other information in this publication is provided based on our state of knowledge at the time of creation of this publication. Information herein may be obtained from sources believed to be reliable. AXA IM HK has reasonable belief that such information is accurate, complete and up-to-date. To the maximum extent permitted by law, AXA IM HK, its affiliates, directors, officers or employees take no responsibility for the data provided by third party, including the accuracy of such data. This material does not contain sufficient information to support an investment decision. References to companies (if any) are for illustrative purposes only and should not be viewed as investment recommendations or solicitations.
All investment involves risk, including the loss of capital. The value of investments and the income from them can fluctuate and that past performance is no guarantee of future returns, investors may not get back the amount originally invested. Investors should not make any investment decision based on this material alone.
Some of the services listed on this Website may not be available for offer to retail investors.
This Website has not been reviewed by the SFC. © 2023 AXA Investment Managers. All rights reserved.